Flowcharts and Diagrams
Flowcharts are a graphical representation of an algorithm. They are used to represent the flow of control in a program.
The algorithms are:
- Unambiguous/well-defined: Each step performs a very clear and unambiguous task.
- Finite: The total number of steps in the algorithm is finite. So, the algorithm will terminate after executing these steps and provide a definite output.
Any structured programming language supports three types of statements (constructs), and these are:
- Sequencing: Executing a set of statements in a sequential order
- Decision-making: Choosing from many alternative paths
- Repetition/Iteration: Executing one or a group of statements in a loop iteratively
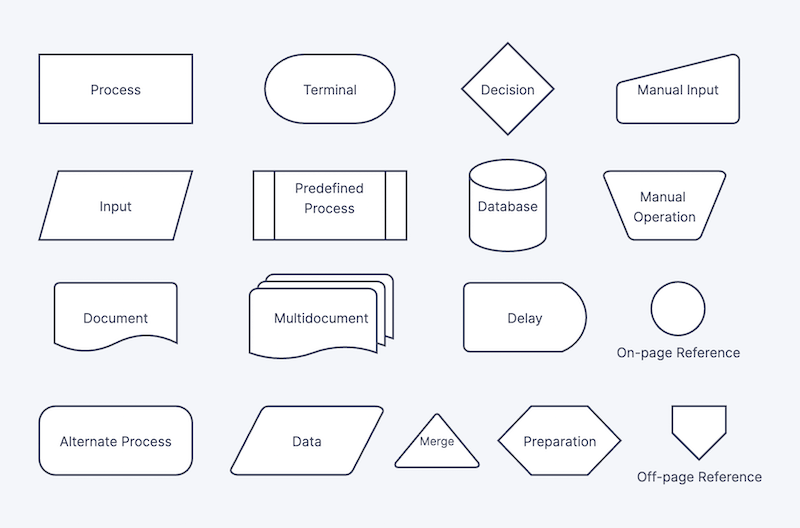
Flowcharts are made up of different symbols that represent different elements of the program. The symbols are connected by arrows to show the flow of control.
| Symbol | Purpose | Description |
|---|---|---|
| Arrow symbol | Flow Line | Indicates the flow of logic by connecting symbols |
| Oval | Terminal(Stop/ Start) | Represents the start and end of a flowchart |
| Parallelogram | I/O | Used for input and output operations. |
| Rectangle | Processing | Used for arithmetic operations and data manipulations. |
| Diamond | Decision | Used for decision making between two or more alternatives |
| Circle | On-page connected | Used to join different flowline |
| Circle Downward Pointed | Off page connector | Used to connect the flowchart on a different page |
| Margined Rectangle | redefined Process/ Function | Represents a group of statements performing one processing task. |